Blender benchmark leak: GeForce RTX 5090 beats 4090 average by 36% 65 comments
Image: Nvidia
According to rumors, in a week, on January 24, the embargo on testing of the Nvidia GeForce RTX 5090 will fall. The likelihood that preliminary results will be (accidentally) leaked increases. In addition to the first results in the Geekbench database, this also happened in the case of the ray-traced rendering benchmark Blender Benchmark.
Geekbench and Blender Benchmark are the usual suspects
Blender Benchmark is a potential pitfall for testers who are not allowed to reveal the results in advance: if the test is recognized with the light blue “Submit result” button when completed, the result is online. This happens even faster with Geekbench, which in the free version loads all results into the online database immediately after the benchmark is completed, without any further interaction.
A first result with Blender Benchmark 3.6.0 and Optix
Techtip reader duklum alerted the editorial team to a first entry of an Nvidia GeForce RTX 5090 in the Blender Benchmark database. The graphics card was tested with the old Blender benchmark version 3.6.0 (currently 4.3.0) and the Nvidia ray tracing “Optix” rendering engine.
Using version 3.6.0 seems odd, but could also indicate that the leak wasn’t entirely unintentional: anyone searching the Blender Benchmark database will initially receive a mask that filtered results by version 4.2.0 – only those manually searching for 3.6.0 or without a version would have seen the RTX 5090 directly. With version 3.6.0 this was possible in a more subtle way.
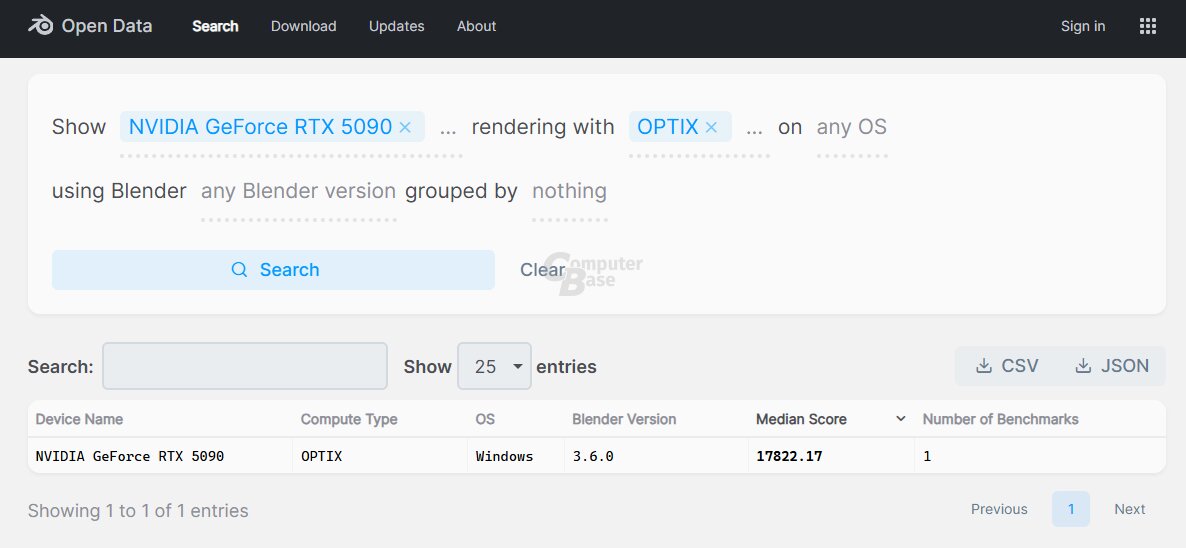 First entry of an Nvidia GeForce RTX 5090 in the Blender benchmark (3.6.0)
The first entry in the database shows a result of 17,822 points for the RTX 5090. This is 36% above the average of 1,449 results reported so far with the GeForce RTX 4090 in the Blender 3.6 benchmark .0 with Optix rendering engine (13,064 points).
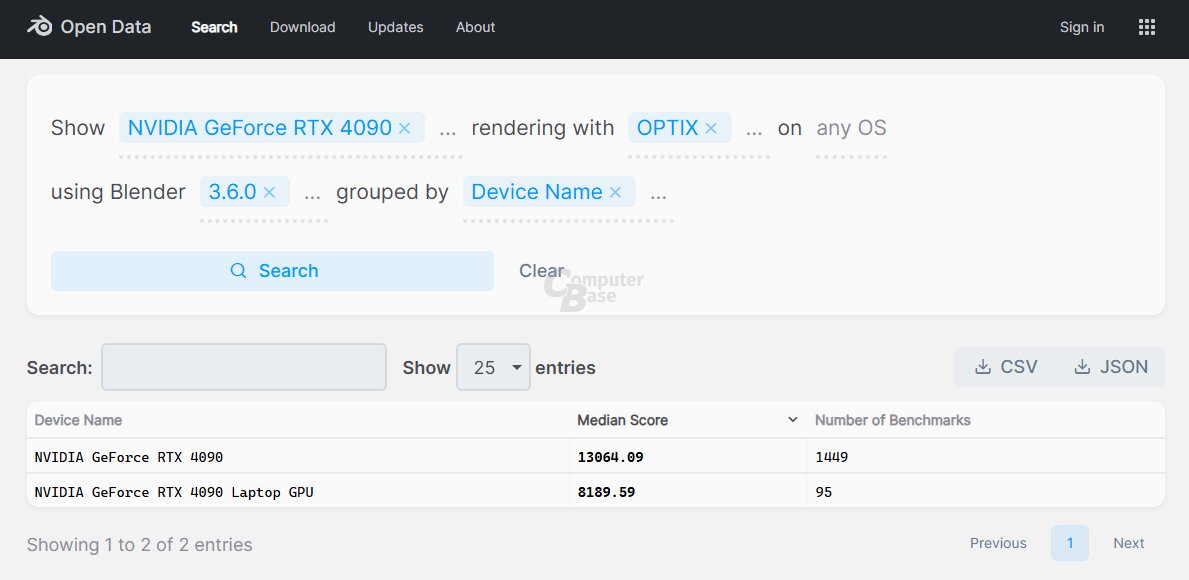 The GeForce RTX 4090 achieves an average of 13,060 points
According to the datasheet, the GeForce RTX 5090 has 33% more shaders and RT units than the GeForce RTX 4090, and the theoretical computing power in TFLOPS is 27% higher due to a slightly higher clock speed. lower.
GeForce RTX 5090 vs. RTX 4090 model GeForce RTX 5090 Architecture GeForce RTX 4090 Blackwell Ada Lovelace GPU GB202* AD102 Active CUs (chip) 170 (192*) 128 (144) active shaders 21,760 16,384 Boost/base clocks 2,410 /2 010 MHz 2520/2230 MHz FP32 ALU 104.9 TFLOPS 82.6 TFLOPS Memory 32 GB GDDR7 24 GB GDDR6X Memory interface 512-bit 384-bit Memory throughput 28 Gbps 21 Gbps Bandwidth 1792 GB/s 1008 GB/s PCI Express 5.0 x16 4.0 ×16 TDP 575 W 450 W Founders Edition Yes 2 slots 3 slots Power connection 1x 12V-2×6 (600 watts) 1x 12VHPWR (600 watts) I/O 3× DisplayPort 2.1b
1 × HDMI 2.1 3 × DisplayPort 1.4a
1× HDMI 2.1 DLSS DLSS 4 DLSS 3.5 AI TOPS 3,352 1,321 Recommended price (VAT included) 2,329 euros 1,949 euros * not confirmed
Also first results with Geekbench
Early Geekbench database entries recorded by VideoCardz show the GeForce RTX 5090 in the Vulkan and OpenCL test scenarios between 26 and 37 and 7 and 15 percent ahead of the RTX 4090, respectively.
Topics: GeForce benchmarks GeForce RTX 50 GeForce RTX 5090 graphics cards Nvidia Nvidia Blackwell

An engineer by training, Alexandre shares his knowledge on GPU performance for gaming and creation.
