Which GeForce RTX 5070 to Buy?: Asus TUF, MSI Gaming Trio, and Zotac Solid vs. Nvidia FE 66 Comments

Which Nvidia GeForce RTX 5070 should you buy? The compact and visually appealing Founders Edition failed to impress in the test with its relatively high volume. The custom designs of the Asus TUF Gaming, MSI Gaming Trio, and Zotac Solid make it all the better in this regard. Table of Contents 1 ASUS TUF, MSI Gaming Trio, and Zotac Solid vs. Nvidia’s Fedrei RTX 5070 Custom Builds in the Test: Test Candidates in a Glance Test System and Test Methodology 2 Test Results and FAZITFPS and Fazity
Three RTX 5070 Custom Builds in the Test
After the NVIDIA GEFORCE RTX 5070 Founders Edition (TEST), the PC market was looking for quieter and more readily available alternatives. In this test, the three custom builds: Asus TUF Gaming OC, MSI Gaming Trio OC, and Zotac Solid are also available after a three-week delay, but only sporadically and directly from Nvidia.
However, the three custom builds tested are now available. The largest premium for the entry-level UVP of 619 euros for the FE, which is now adjusted to the stronger euro, will be followed by Asus, followed by MSI. The Zotac Solid as the “MSPR model” ranks considerably higher in the price comparison and has already been repeated in the past for less than 649 euros, as evidenced by the editorial team’s RTX 50 availability check.
NVIDIA GEFORCE RTX 5070 FOUNDERS EDITION (TEST) – AB 619 EURO ASUS GEFORCE RTX 5070 TUF GAMING OC – AB 795 EURO MSI GEFORCE RTX 5070 Gaming Trio – AB 759 EURO Zotac Geforce RTX 5070 Solid – AB 660 EURO
Test candidates at a glance
The test candidates will only be briefly presented below before the next page with test results, benchmarks, and conclusions.
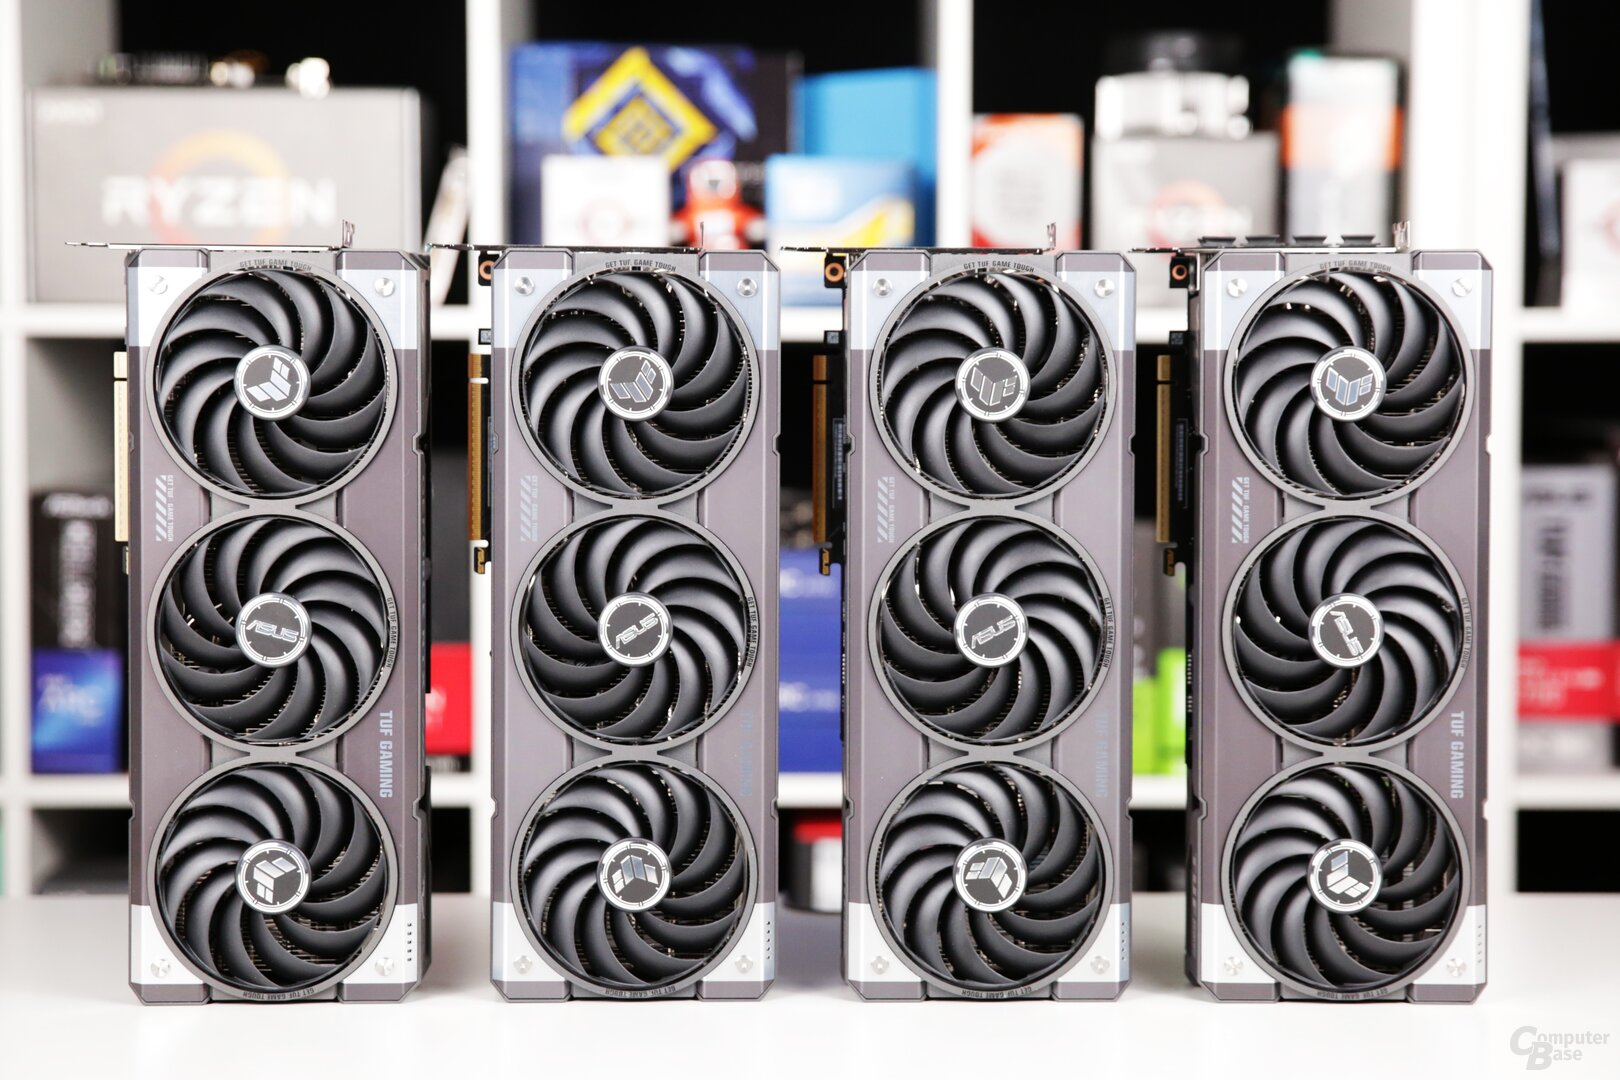
The ASUS TUF GAMING OC IM Details
The ASUS GEFORCE RTX 5070 TUF Gaming OC relies on the same cooling system as the GeForce RTX 5070 Ti, Radeon RX 9070 XT, and Radeon RX 9070. The cooler is solid and can be operated in Performance (EX Works) or Silent BIOS.
There are no differences in clock rates or TDP between the BIOS versions; only the fan control is adjusted. In both BIOS versions, a slightly higher clock of 2,610 MHz Boost EX Works is available (standard: 2,512 MHz). The TDP officially remains at 250 watts, but can be increased to 300 watts (FE: maximum 275 watts). Radeon RX 9070 XT vs. GeForce RTX 5070 Ti and Radeon RX 9070 vs. GeForce RTX 5070 (ASUS TUF GAMING)
Radeon RX 9070 XT vs. GeForce RTX 5070 Ti and Radeon RX 9070 vs. GeForce RTX 5070 (ASUS TUF GAMING)
 The MSI GeForce RTX 5070 Trio OC, even longer but not quite as thick (2.5 slots), is a class below, as its cooler cover is made of plastic. This design is much lighter for that, and the subtle triple RGB lighting under the transparent cover is something else.
Like ASUS’s TUF Gaming, the MSI Gaming Trio comes with a boost of 2,610 MHz, but the standard TDP EX (250 watts), which can be increased to 280 watts. There’s no second BIOS or a second HDMI port.
The Zotac Solid IM Detail
The solid Zotac GeForce RTX 5070 is no thicker and “only” six centimeters longer than the Founders Edition. It weighs less than a kilogram.
As a non-OC variant, it comes with the same clock speeds and TDP as the Founders Edition (an alternative OC version offers 30 MHz more) and, like the MSI gaming trio, does without a second BIOS.
Even with the maximum power limit, the 275-watt trooper doesn’t exceed the reference level. The RGB lighting at the graphics card’s end can be customized by ASUS and MSI using the Zotac Firestorm software. Key technical data in comparison
Key technical data of the four GeForce RTX 5070s in the test in comparison with nvidia characteristics
Asus Founders Edition
TUF Gaming MSI Gaming Trio Zotac Solid state PCB design nvidia asus MSI Zotac Length, width 24.2 cm, 11.2 cm 33.0 cm, 14.0 cm 34.0 cm 30.5 cm, 11.5 cm Power supply 1 × 16-pin (12V-2 × 6, 5.1 ft) Cooling design Color trio, 2.5 solid slots, 2.0 slot heat pipes
Aluminum radiator weight 1,108 g 1,175 g 960 g Fan 2 × 91 mm (axial) 3 × 100 mm (axial) 3 × 95 mm (axial) 3 x 90 mm (axial) fan
Average GPU 2512 MHz 2610 MHz 2512 MHz Memory 14000 MHz Memory size 12 GB GDDR7 Power consumption Typical TDP 250 W MAX TDP 275 Watts 280 Watts 275 Watts 3 x DisplayPort 2.1
1 x HDMI 2.1 3 x DisplayPort 2.1
2 x HDMI 2.1 3 x DisplayPort 2.1
1 x HDMI 2.1
Test system and test methodology
In the gap between the known GPU Test System 2025, a new system has been configured for testing custom designs. During these heated weeks, it may be prevented from launching reviews of a new class and hindering the testing of custom designs.
Custom design testing in another case
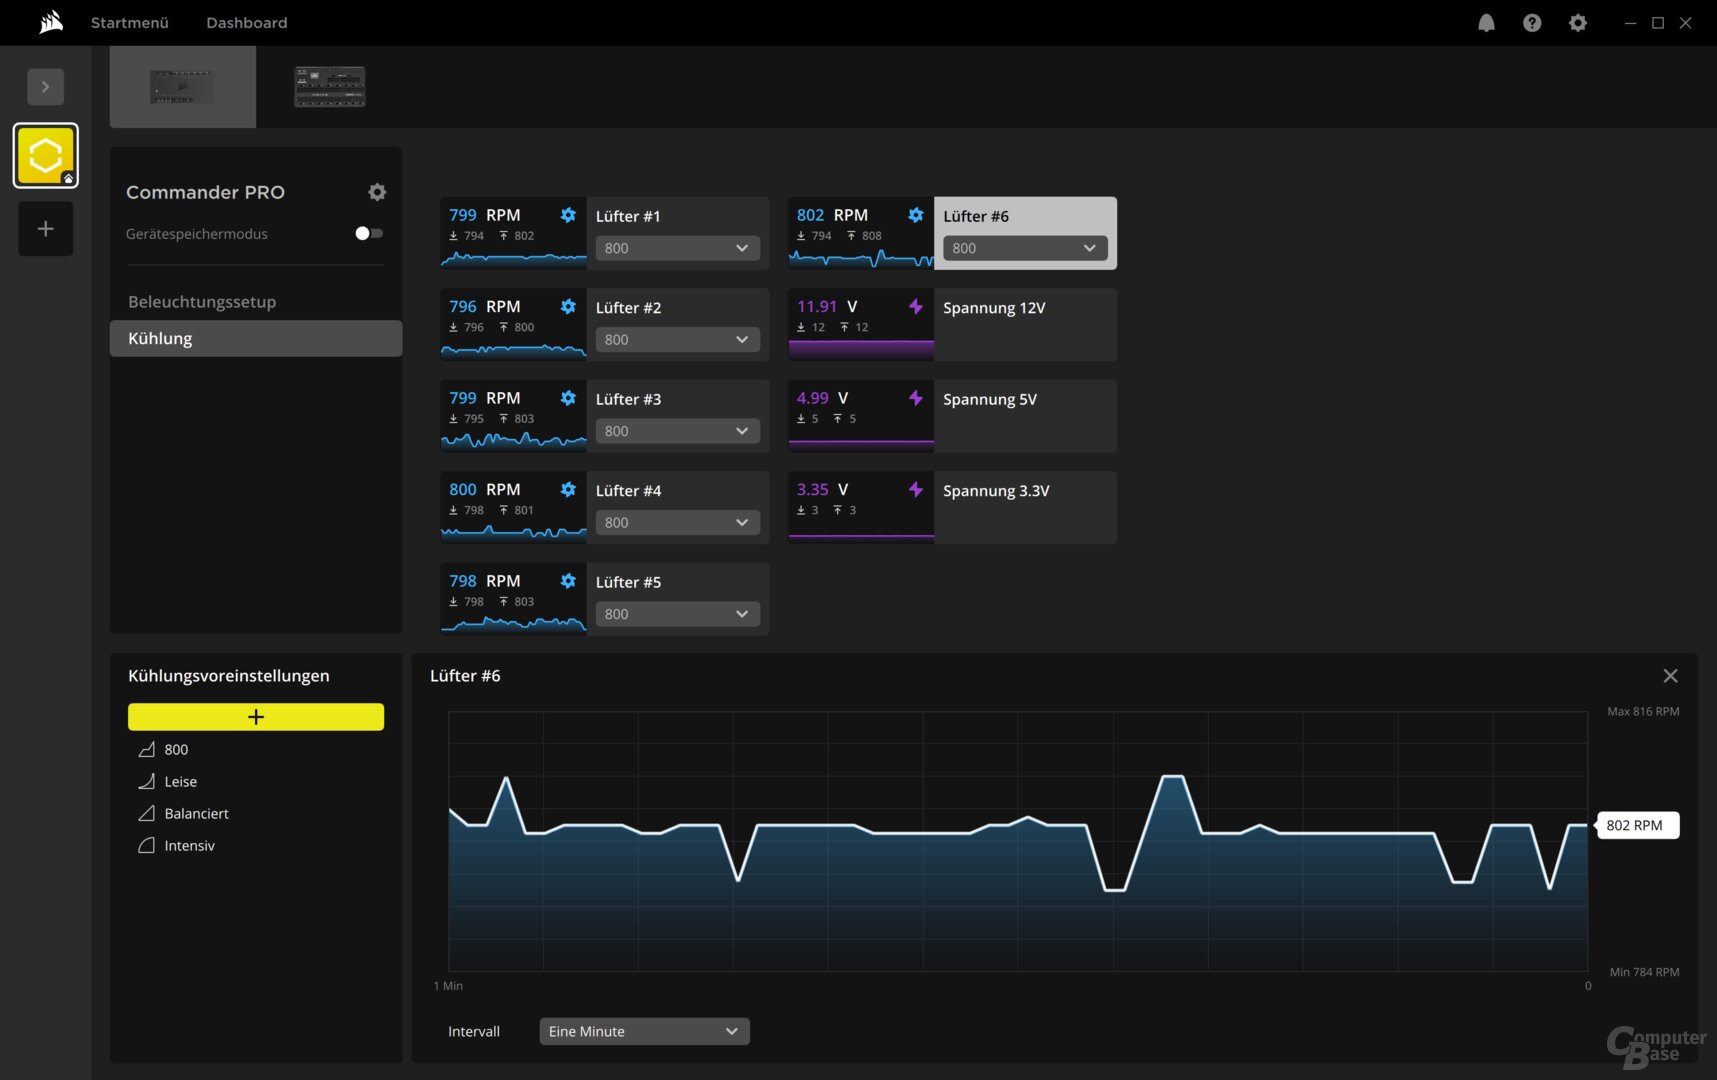
An AMD Ryzen 7 9800x3d (test) with DDR5-6000 is also in the custom design test system, but the case is completely different: instead of the Fractal Design Torrent, the Fractal Design Meshify 2 is used with six fans (two in the front), three in the lid, and one in the rear (all blown). All housing fans are operated at a constant 800 rpm, which is barely noticeable. Control is via a Corsair Commander Pro or Corsair Icue (download). The six housing fans operate at 800 rpm, the CPU cooler fan at 1,000 rpm.
The six housing fans operate at 800 rpm, the CPU cooler fan at 1,000 rpm.
The CPU cooler fan, a Noctua NH-U12S Redux, rotates at 1,000 rpm.
All tests and benchmarks are conducted in this configuration; only the volume measurement takes place with the fans deactivated, isolated from the graphics card (30 cm distance from the side door with the fan open under load).
Both available BIOS versions are tested in the test. For this purpose, the graphics card (as in the standard test course) is operated in Metro Exodus Enhanced Edition in UHD for maximum detail and with the housing wall closed. A benchmark is performed after 5 minutes. The benchmark results and measured values for temperatures, speeds, clock rates, and power consumption are then recorded.
 Test results and concluding points: Graphics card overview

An engineer by training, Alexandre shares his knowledge on GPU performance for gaming and creation.